15 Jul
Line chart
As any other charts the line one uses points connected by line segments from left to right to demonstrate changes in value. Instead of showing the data of the opening and closing as well as the highest/lowest price with tails as with candlestick charts, we can observe here just a single line. It can be measured by the different scales (it is useful for the other charts too): Linear and Logaritmic. The difference between them is how the y-axis (price one, x stands for time) of a chart is spaced.
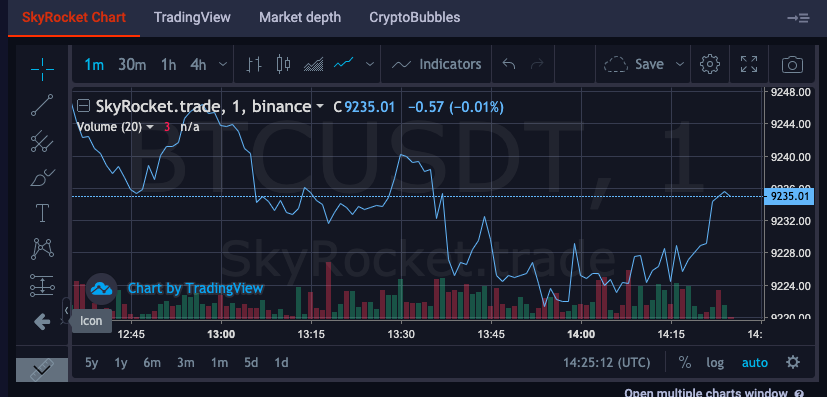
-In the Linear one the spacing of the price is equal – in the other words the value between two consecutive points on the line is not changing not changing no matter how high or low you are on it.
– The logarithmic scale is the opposite. Value between two points on the axis will be changing and it will have some pattern to this changes.
For some linear charts people can better see the speed of price changes and the log one is more helpful in terms of seeing the trend so that’s why it is useful to check both of them once in a while.
Market Depth chart and liquidity
In very short words liquidity means that the asset such as crypto can be sold easily at the stable price. A bit wider definition we can say it is a a measure of how many buyers and sellers are on the market. In most cases liquidity will be calculated by taking the volume of the pending orders currently on the market.
Knowing if the market is liquid or illiquid is quite important as it indicates if your orders will be completed easily and at a given price. Due to that fact you can say also that assets with good liquidity are generally a bit more safe.
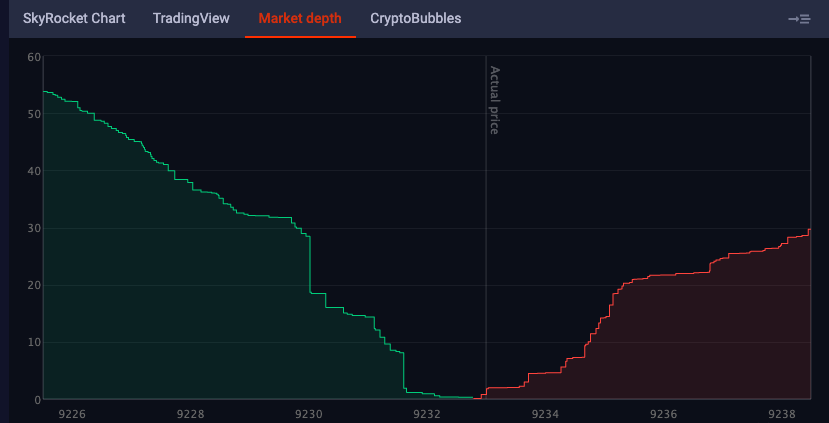
Market depth chart is a visualization of the buy and sell orders of the asset (BTC/USDT in the picture) at the certain prices. In this chart we can exactly see how big is the amount of assets you can buy or sell at some price (buy orders are green on the left side and sell are red on the right).

In the case of liquid assets you will see both the green and red part of the chart looking almost the same. It is important to check the liquidity as in some cases you will buy the coin that cannot be really sold at the price you wish for. In the very illiquid market selling a big amount of asset can create Flash Clash situation. About Flash Crashes and how we can earn when they happen we wrote in our previous article – it can be checked here.
https://skyrocket.trade/most-famous-flash-crashes-in-crypto-history/